- Methodology
- Open access
- Published:
Modeling to explore and challenge inherent assumptions when cultural norms have changed: a case study on left-handedness and life expectancy
Archives of Public Health volume 81, Article number: 137 (2023)
Abstract
Background
In 1991, Halpern and Coren claimed that left-handed people die nine years younger than right-handed people. Most subsequent studies did not find support for the difference in age of death or its magnitude, primarily because of the realization that there have been historical changes in reported rates of left-handedness.
Methods
We created a model that allowed us to determine whether the historical change in left-handedness explains the original finding of a nine-year difference in life expectancy. We calculated all deaths in the United States by birth year, gender, and handedness for 1989 (the Halpern and Coren study was based on data from that year) and contrasted those findings with the modeled age of death by reported and counterfactual estimated handedness for each birth year, 1900–1989.
Results
In 1989, 2,019,512 individuals died, of which 6.4% were reportedly left-handed based on concurrent annual handedness reporting. However, it is widely believed that cultural pressures may have caused an underestimation of the true rate of left-handedness. Using a simulation that assumed no age of death difference between left-handed and right-handed individuals in this cohort and adjusting for the reported rates of left-handedness, we found that left-handed individuals were expected to die 9.3 years earlier than their right-handed counterparts due to changes in the rate of left-handedness over time. This difference of 9.3 years was not found to be statistically significant compared to the 8.97 years reported by Halpern and Coren. When we assumed no change in the rate of left-handedness over time, the survival advantage for right-handed individuals was reduced to 0.02 years, solely driven by not controlling for gender. When we considered the estimated age of death for each birth cohort, we found a mean difference of 0.43 years between left-handed and right-handed individuals, also driven by handedness difference by gender.
Conclusion
We found that the changing rate of left-handedness reporting over the years entirely explains the originally reported observation of nine-year difference in life expectancy. In epidemiology, new information on past reporting biases could warrant re-exploration of initial findings. The simulation modeling approach that we use here might facilitate such analyses.
Background
In 1991, Halpern and Coren published brief [1] and more detailed [2] reports that claimed that left-handed people die nine years younger than right-handed people and suggested that left-handed people are at a higher risk of death at any given age. The authors arrived at their conclusions based on analysis of surveys sent to family members of people who died in 1989 in two southern California counties that asked about the decedents’ handedness. They attributed the nine years difference to both pathological factors and environmental interactions: the increased risk of death was likely due to correlates of left-handedness, not the left-handedness itself, as well as a potential increase in accidents due to interactions with the technological environment [1, 2].
The study was frequently cited, sometimes suggesting problems with the analysis and disagreeing with the findings [3]. Various letters to the editor were written in reply to the study, suggesting methodological problems [3,4,5]. One critique of a similar finding pointed out that findings of shorter lifespans in left-handed people could be explained by the fact that – because of social pressures - the percentage of left-handed people had been growing in the population over time [6].
Various subsequent studies of athletes [7,8,9] did not find significant differences in lifespan based on handedness, and a study of 118 same-sex twin pairs with opposite-handedness found that slightly more right-handed individuals died before their non-right-handed twin [10].
The likely confounder – that reporting of handedness changed over time, in part due to increasing cultural acceptance of left-handedness – was supported by a self-report survey of 1,177,507 National Geographic readers aged 10 to 86 that found non-right-handedness was most prevalent at younger ages (14% in men, 12% in women) and least prevalent among the elderly (6% for both men and women) and concluded that the reduction in non-right-handedness was consistent with a historical reduction in sanctions on left-handed writing early in the 20th century [11]. A later examination of survey data in the United Kingdom showed that the rate of complete left-handedness was ~ 3% for those born around 1900 and increased substantially by the mid-20th century [12].
This kind of confounding – wherein a measure as reported in real time might not reflect reality because of social or cultural normative pressures – might not be uncommon in longitudinal epidemiological studies. By using this cultural change in left-handedness reporting as an example, we developed a method that allows for comparison of mortality based on originally reported and actual (or estimated actual) data on a key variable, one that might be used more broadly in longitudinal epidemiological studies. Specifically, our three-step method uses concurrently reported estimates of the demographic factor in question (handedness as reported at the time, influenced by contemporary culture) to replicate the study in question (the Halpern-Coren study), uses counterfactual demographic data (handedness as estimated, without contemporary cultural bias) to simulate study finding estimates had the cultural bias not existed, and compares findings from the two estimates.
Results
Number of births, right-handed and left-handed people, and deaths in 1989
The number of live births per year varied from 2,272,205 in 1900 to 4,308,000 in 1957 (Fig. 1), with the cumulative number of live births from 1900 to 1988 being 284,453,782 and consisting of 143,933,614 men (50.6%) and 140,520,168 women (49.4%) (Supplemental Tables 1, left).

Between 1900 and 1988, the rate of concurrently reported left-handedness varied from 2.5% to 1902 to 12.6% in 1965 (Fig. 2). The mean rate of left-handedness was 8.9% (9.9% (range 2.4–14.1%) for men and 7.9% (2.7–11.9%) for women) (Supplemental Tables 1, right).
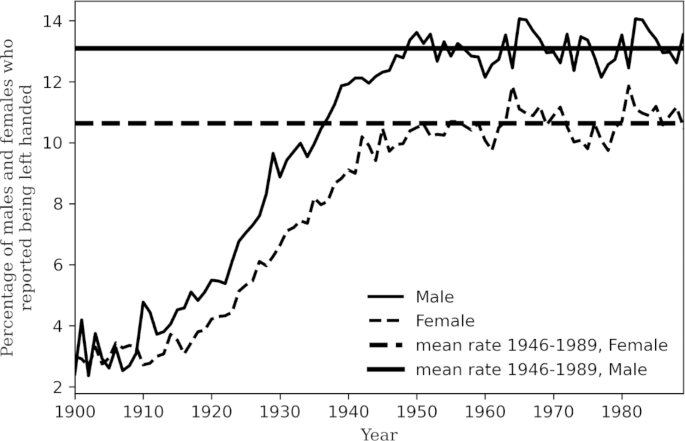
Rate of left-handed people by birth year and gender, United States, 1900–1988. Data extracted from the handedness study [12]. Horizontal lines show mean rates for each gender during the period 1946–1989
We estimated that 2,019,517 people (1,043,504 men and 976,013 women) who were born between 1900 and 1988 died in 1989 (Supplemental Table 2). Assuming no handedness-related difference in mortality rates, we estimated that 1,891,554 (93.7%) were right-handed and 127,963 (6.3%) were left-handed, 77,452 of whom were men and 51,751 of whom were women (Supplemental Table 2).
Age at death of left-handed and right-handed people in 1989
Our bootstrap analysis of 1,000 random samples of 987 deaths in 1989 found that right-handed people lived 9.3 years longer than left-handed people (95% CI: 4.3–14.4 years), (Fig. 3), results not statistically different from the 8.97 years difference reported by Halpern and Coren [1, 2] (p-value of 0.481 obtained from parametric bootstrapping).

Distribution of difference in age at death of the 1989 United States death cohort. To estimate the mean difference and the confidence interval we ran 1,000 bootstraps of subsets of 989 individuals in the dataset to simulate the data from the Halpern and Coren study [1]. The left y-axis indicates the histogram counts, the right y-axis indicates the probability distribution function values (density). The black curve indicates the distribution plot fitted with the KDE method. The long vertical black line indicates the mean difference (9.3 years); the short vertical black lines indicate the confidence interval (4.26–14.40 years)
Age at death of left-handed and right-handed people in 1989 assuming constant handedness rates
Reported left-handedness rates were stable between 1946 and 1989. The mean left-handed rates for male and female subjects computed over this period were 13.1% and 10.6% respectively (shown with horizontal lines in Fig. 2). Assuming that these were indeed the constant rate of left-handedness for all the birth cohorts between1900-1989, we repeated our bootstrap analysis for 987 samples of population who died in 1989. Contrary to the previous analysis where we used actual reported handedness rates, we found essentially no difference (0.02 years) between the age of death of left-handed (61.82 years) and right-handed people (61.84 years).
Discussion
We used several data sources to model the number of left- and right-handed men and women who died in the United States in 1989 and a bootstrapped sampling approach to replicate findings from Halpern and Coren, and we found similar results to theirs when not correcting for the historical change in handedness ratios. However, when appropriately controlling for handedness rates per birth cohort using two different methods, we found very little difference in longevity between left- and right-handed individuals.
In essence, our analysis reveals an example of classical data fallacy, wherein only numerators of rates are compared rather than the rates themselves, which is surprisingly common in the medical literature [15]. For instance, in articles claiming that anesthesiologists [16] and female doctors die younger than other doctors, [17] reported differences resulted from the fact that a greater proportion of anesthesiologists and women, respectively, had recently entered medical school, therefore biasing the samples [15]. Halpern and Coren dismissed from the outset the possibility that a change in left-handedness rate could have affected the results, thereby allowing the classical data fallacy to influence their findings.
Death cohort studies are challenging because they assume that the underlying ratio of.
populations is stable through the years, and this can be inaccurate [18, 19]. On the other hand, birth cohort studies solve part of this problem, though they can still be affected by confounding effects [20, 21]. When cultural norms change, similar scenarios may arise in public health cohort studies that explore, for instance, relationships between health outcomes and characteristics like gender identity, sexual orientation and behavior, reported social distancing behavior during COVID-19 pandemic, and illicit substance use where temporal variations in underlying confounding factors could be overlooked [29, 30].
This study has several limitations. The first is that estimated actual rates of handedness used were based on survey data of nearly 1.2 million readers of the National Geographic collected in 1986 [11] who were not representative of the US population in racial distribution; because there is some ethnic variation in handedness rates, [22] and we could not include data on race and ethnicity in our analysis, our findings are limited. The second limitation is that our methodology relies on a simulation of the data from Halpern and Coren’s study and hence does not represent the exact same sample. Finally, while using birth cohorts, as we did, solves some death cohort study problems, birth cohort studies can still be affected by confounders [29, 30]. Since, by design, we anticipated no difference on mortality depending on handedness, the reason for the minor difference is likely because we could not control for gender.
Conclusions
In conclusion, we have shown that the changing rate of left-handedness over the years entirely explains the nine-year difference in life expectancy that was originally reported. Our methods might be used in other epidemiological studies wherein reported rates of a particular variable change over time, perhaps influenced by changing cultural norms.
Methods
Using the hypothesized relationship between handedness and longevity as an example, we developed a three-step method that (a) uses concurrently reported estimates of the demographic factor in question (handedness as reported at the time, influenced by contemporary culture) to replicate the study in question (the Halpern-Coren study), (b) uses counterfactual demographic data (handedness as estimated, without contemporary cultural bias) to simulate study finFig. 4t existed, and (c) compares findings (Fig. 4).

Methodology used. The overall, three-step methodology we used is outlined in the boxes at the top. Data sources and the specific methods used for the handedness example for each step are provided in the table at the bottom
To replicate findings from Halpern and Coren’s original California-based study, we generated a national estimate of the number of people that died in 1989 using three steps. First, we extracted the number of men and women born each year in the US between 1900 and 1988 from National Center of Health Statistics birth data [13, 14]. Second, we estimated the gender-specific number of births that were left- versus right-handed for each birth year from 1900 to 1988 based on McManus’ study of National Geographic readers that estimated handedness rates from 1900 to 2000 [12]. Third, under the assumption that handedness was not associated with mortality, we estimated the number of people who died in 1989 by gender and year of birth by crossing the birth data with the data from the Actuarial Life Table corresponding to birth year (Fig. 5) [23].

Actuarial data by 20-year birth year cohort (1900–1980), United States. Data extracted from the Actuarial Life Table [23]. While data shown combine males and females for ease of display, our analysis used gender-specific data for each cohort
Given birth year (i), death year (y), handedness (h), and gender (g), we estimated the deaths as:
For example, according to the US birth data, [13, 14] there were 1.37 million male births in the US in 1909 (Supplemental Table 1). Based on the handedness rates study, 3.11% of those births (42,000) were left-handed males [12]. Using the Actuarial Life Table for males born in 1909, [23] we estimated that 1.5% of those males died when they were 80 years of age (Supplemental Table 2). So, assuming no handedness-related mortality differences, our model estimates that 20,774 right-handed and 667 left-handed individuals who were born in 1909 died in 1989.
Estimated total number of right- and left-handed people who died in 1989
To arrive at an estimated total number of right- and left-handed men and women who died in 1989 and were born between 1900 and 1988, we simply summed annual estimates of deaths in 1989 by gender and handedness for those years. To simulate the sample set from Halpern and Coren that was based on 987 individuals that died in southern California in 1989, [1] we used 1,000 bootstraps of randomly selected samples of 987 from the distribution of individuals who died in 1989 and estmated 95% confidence intervals.
Total number of right- and left-handed people that would have died in 1989, assuming constant handedness rates
In our next analysis, we considered the counterfactual scenario where the handedness rates were reported to constant (due to hypothetical absence of varying social factors). Assuming the constant rate to be the mean of the rates during the period 1946–1989, when less fluctuations were seen, we calculate estimated number deaths in 1989, both for right- and left-handed people.
Statistical analysis
To incorporate historically changing left-handedness reporting in the United States during the period examined, we extracted the estimated rates of left-handedness from plots in McManus’s study [12] using The WebPlotDigitizer [24] tool. We used Python v3.6 and standard libraries like Pandas and NumPy [25,26,27] for statistical processing and data analysis. Mean estimated ages of death were compared with a student’s t-test. The kernel density estimation (KDE) method estimated the probability distribution function of the difference in age of death between right-handed and left-handed individuals [28].
Data Availability
Our study utilizes publicly available open-source data. The data sample used in the study could be replicated following our methods using open source standard tools and software.
References
Halpern DF, Coren S. Handedness and life span. N Engl J Med. 1991;324:998.
Coren S, Halpern DF. Left-handedness: a marker for decreased survival fitness. Psychol Bull. 1991;109:90–106.
Harrell HL, Correspondence. Left-handedness and life expectancy. N Engl J Med. 1991;325:1041.
Morens DM, Katz AR, Correspondence. Left-handedness and life expectancy. N Engl J Med. 1991;325:1041.
Rothman KJ, Correspondence. Left-handedness and life expectancy. N Engl J Med. 1991;325:1041.
Peto R. Left handedness and life expectancy. Causal inferences cannot be trusted. BMJ. 1994;308:408.
Aggleton JP, Kentridge RW, Neave NJ. Evidence for longevity differences between left handed and right handed men: an archival study of cricketers. J Epidemiol Community Health. 1993;47:206–9.
Hicks RA, Johnson C, Cuevas T, Deharo D, Bautista J. Do right-handers live longer? An updated assessment of baseball player data. Percept Mot Skills. 1994;78:1243–7.
Panjer HH. Mortality differences by handedness: survival analysis for a right-truncated sample of baseball players. Trans Soc Actuaries. 1993;45:257–74.
Basso O, Olsen J, Holm NV, Skytthe A, Vaupel JW, Christensen K. Handedness and mortality: a follow-up study of danish twins born between 1900 and 1910. Epidemiology. 2000;11:576–80.
Gilbert AN, Wysocki CJ. Hand preference and age in the United States. Neuropsychologia. 1992;30:601–8.
McManus IC, Moore J, Freegard M, Rawles R. Science in the making: right hand, left Hand. III: estimating historical rates of left-handedness. Laterality. 2010;15:186–208.
National Center for Health Statistics. Live births, Birth Rates, and Fertility Rates, by race: United States, 1909–2000. In: Prevention CfDCa; 2003.
Birth data. Centers for Disease Control and Prevention., 2018. (Accessed June 18, 2018, at https://www.cdc.gov/nchs/nvss/births.htm).
McManus IC. Increased mortality in women doctors. Lancet. 1995;345:796–7.
Katz JD. Do anesthesiologists die at a younger age than other physicians? Age-adjusted death rates. Anesth Analg. 2004;98:1111–3.
Editorial. Burnished or burnt out: the delights and dangers of working in health. The Lancet. 1994;344:1583–4.
Richardson DB, Keil AP, Tchetgen Tchetgen E, Cooper G. Negative control outcomes and the analysis of standardized mortality ratios. Epidemiology. 2015;26:727–32.
Richardson DB, Keil AP, Cole SR, MacLehose RF. Observed and expected mortality in Cohort Studies. Am J Epidemiol. 2017;185:479–86.
Lawlor DA, Andersen AM, Batty GD. Birth cohort studies: past, present and future. Int J Epidemiol. 2009;38:897–902.
Canova C, Cantarutti A. Population-Based birth cohort studies in Epidemiology. Int J Environ Res Public Health 2020;17.
McManus IC. The history and geography of human handedness. In: Sommer IEC, Kahn RS, editors. Language lateralization and psychosis. Cambridge: Cambridge University Press; 2009. pp. 37–57.
Actuarial Life Table 2018. (Accessed June 18, 2018, at https://www.ssa.gov/oact/STATS/table4c6.html).
Marin F, Rohatgi A, Charlot S. WebPlotDigitizer, a polyvalent and free software to extract spectra from old astronomical publications: application to ultraviolet spectropolarimetry. arXiv2017.
Python. 2001. at https://www.python.org/.).
McKinney W. Data Structures for Statistical Computing in Python. In: van der Walt S, Millman J, editors. Proc of the 9th Python in Science Conference; 2010 June 28- July 3, 2010; Austin, Texas.
Harris CR, Millman KJ, van der Walt SJ, et al. Array programming with NumPy. Nature. 2020;585:357–62.
Parzen E. On estimation of a probability density function and mode. Ann Math Statist. 1962;33:1065–76.
Cislaghi B, Heise L. Gender norms and social norms: differences, similarities and why they matter in prevention science. Sociol Health Illn. 2020;42:407–22. https://doi.org/10.1111/1467-9566.13008.
Keyes KM, Schulenberg JE, O’Malley PM, Johnston LD, Bachman JG, Li G, Hasin D. Birth cohort effects on adolescent alcohol use: the influence of social norms from 1976 to 2007. Arch Gen Psychiatry. 2012;69(12):1304–13.
Acknowledgements
We would like to thank Esther van de Vosse for her tremendous help with reviewing, editing, and providing feedback on the manuscript.
Funding
This work was funded by Microsoft AI for Health.
Author information
Authors and Affiliations
Contributions
Authors’ contributions. JLF and WBW conceptualized the study. JLF, MN, and AB analysed the data. JLF, MN, SVS, and WBW interpreted the results. JLF, MN, and WBW drafted the manuscript. All authors contributed to manuscript editing and approval of the final product.
Corresponding author
Ethics declarations
Ethics approval and consent to participate
Our study was conducted using deidentified aggregated and publicly available existing data and included statistical simulations.
Consent for publication
All authors have consented to publication of the manuscript.
Competing interests
There is no financial or non-financial competing interest applicable to any of the authors.
Additional information
Publisher’s Note
Springer Nature remains neutral with regard to jurisdictional claims in published maps and institutional affiliations.
Electronic supplementary material
Below is the link to the electronic supplementary material.
Rights and permissions
Open Access This article is licensed under a Creative Commons Attribution 4.0 International License, which permits use, sharing, adaptation, distribution and reproduction in any medium or format, as long as you give appropriate credit to the original author(s) and the source, provide a link to the Creative Commons licence, and indicate if changes were made. The images or other third party material in this article are included in the article’s Creative Commons licence, unless indicated otherwise in a credit line to the material. If material is not included in the article’s Creative Commons licence and your intended use is not permitted by statutory regulation or exceeds the permitted use, you will need to obtain permission directly from the copyright holder. To view a copy of this licence, visit http://creativecommons.org/licenses/by/4.0/. The Creative Commons Public Domain Dedication waiver (http://creativecommons.org/publicdomain/zero/1.0/) applies to the data made available in this article, unless otherwise stated in a credit line to the data.
About this article

Cite this article
Ferres, J.L., Nasir, M., Bijral, A. et al. Modeling to explore and challenge inherent assumptions when cultural norms have changed: a case study on left-handedness and life expectancy. Arch Public Health 81, 137 (2023). https://doi.org/10.1186/s13690-023-01156-6
Received:
Accepted:
Published:
DOI: https://doi.org/10.1186/s13690-023-01156-6